FX Blue Freehand Drawing indicator for MT4 - User guide
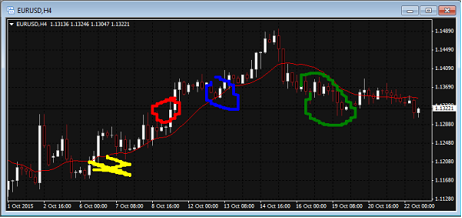
The Freehand Drawing indicator lets you draw onto MT4 charts, in order to mark or highlight events on the chart. It is particularly useful if you are running a live webinar for clients, or distributing screenshots or chart files to people.
1Overview
The Freehand Drawing indicator lets you draw onto MT4 charts, in order to mark or highlight events on the chart. It is particularly useful if you are running a live webinar for clients, or distributing screenshots or chart files to people.

You draw on the chart simply by holding down a key while you move the mouse. You can change colours using keyboard shortcuts, and you can quickly undo any drawing which went wrong.
1.1Licence
Unless otherwise specified in writing by FX Blue, this software is licensed for personal use only. You are not allowed to distribute it to other people, regardless of whether or not money is changing hands. You only have a licence to use the software if you, personally, downloaded it from our website.
The software is provided entirely at the user's risk, and you should check it thoroughly before deploying it on computers trading real money. FX Blue accepts no responsibility whatsoever for any loss of any kind caused by installation or use of the software.
2.1Adding the indicator to a chart
You add the Freehand Drawing indicator to a chart in the usual MT4 way, either by dragging it from the Navigator onto a chart, or by double-clicking on it in the Navigator. You can also use standard MT4 features such as adding the indicator to your list of Favorites, or assigning a Hotkey to it.
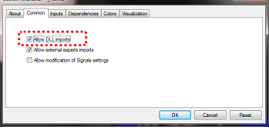
You need to turn on the "Allow DLL imports" setting in the "Common" tab of the indicator's options:

2.2Drawing on the chart
You draw on the chart simply by holding down the D key while you move the mouse.
2.3Changing colours
You can start drawing in a new colour using keyboard shortcuts. For example, after pressing the B key, all further drawing will be in blue.
The list of colours and their keys is as follows:
R = red
B = blue
G = green
Y = yellow
N = black
W = white
2.4Undoing the most recent drawing
You can delete the most recent drawing by pressing the X key. Pressing X again deletes the previous drawing etc.
2.5Line width and other indicator options
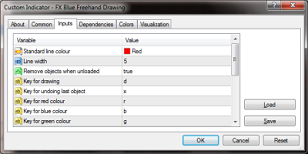
You can change the width of the drawn lines using the settings on the "Inputs" tab when you add the indicator to a chart:

You can also use these settings to change all the shortcut keys. You can even change the colours, e.g. so that "red" (pressing R) then draws in purple.

