NZD/USD Price Forecast: Aims to extend upside towards 0.6000
- NZD/USD advances to near 0.6000 as the NZ Dollar capitalizes on an upbeat market mood.
- Inflation in China declined at a faster-than-expected pace in August.
- Investors await key US PPI data for August.
The NZD/USD pair trades 0.22% higher around 0.5940 during the European trading session on Wednesday. The Kiwi pair gains as antipodeans outperforms its peers, following an upbeat market mood. The appeal of riskier assets has increased as the Federal Reserve (Fed) is certain to cut interest rates in the policy meeting next week.
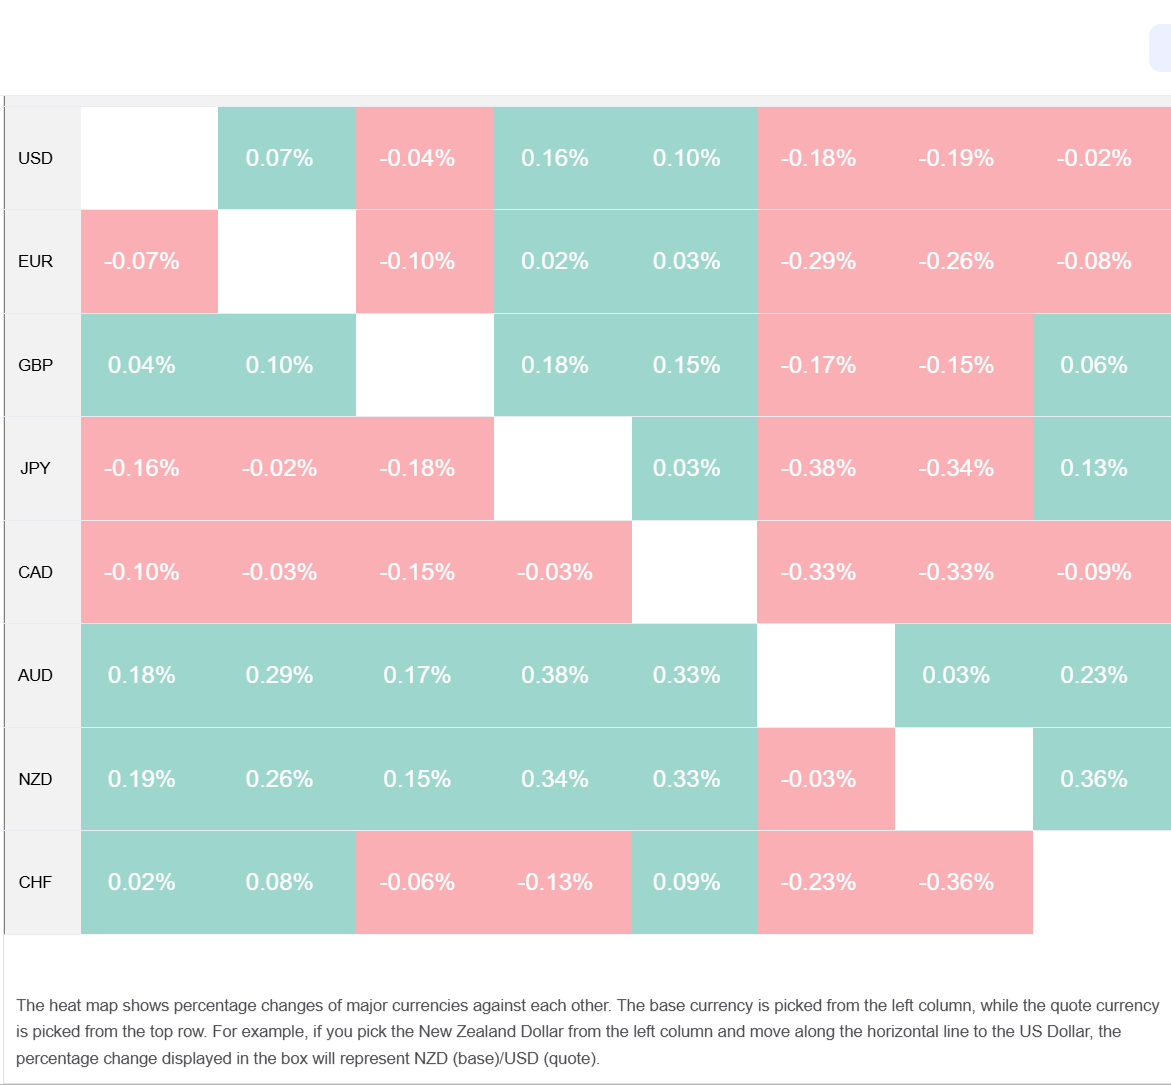
New Zealand Dollar Price Today
The table below shows the percentage change of New Zealand Dollar (NZD) against listed major currencies today. New Zealand Dollar was the strongest against the Swiss Franc.
 According to the CME FedWatch tool, traders see an 8.4% chance that the Fed will cut interest rates by 50 basis points (bps) to 3.75%-4.00%, while the rest point a standard 25-bps interest rate reduction.
The New Zealand Dollar (NZD) trades firmly even as China’s Consumer Price Index (CPI) data for August has come in softer-than-projected. Inflationary pressures in China have declined at an annual pace of 0.4%. China’s annual inflation was expected to decline but at a slower pace of 0.2% after remaining flat in July. On a monthly basis, China’s CPI remained flat.
Technically, declining inflationary pressures in China act as headwind for the NZD, given that the New Zealand (NZ) economy relies heavily on its exports to Beijing.
Meanwhile, the US Dollar (USD) trades steadily ahead of the United States (US) Producer Price Index (PPI) data for August, which will be published at 12:30 GMT.
NZD/USD trades at a make-or-break level near the downward-sloping trendline around 0.5930, which is plotted from the July 1 high near 0.6120. The near-term trend of the pair is bullish as it trades above the 20-day Exponential Moving Average (EMA), which is around 0.5900.
The 14-day Relative Strength Index (RSI) approaches 60.00. A fresh bullish momentum would emerge if the RSI breaks above that level.
Going forward, the Kiwi pair would rise towards the June 19 high of 0.6040 and the September 11 low of 0.6100 if it manages to return above the psychological level of 0.6000.
In an alternate scenario, a downside move by the pair below the August 2 low of 0.5800 will expose it to the April 11 low of 0.5730, followed by the round-level support of 0.5700.
NZD/USD daily chart
According to the CME FedWatch tool, traders see an 8.4% chance that the Fed will cut interest rates by 50 basis points (bps) to 3.75%-4.00%, while the rest point a standard 25-bps interest rate reduction.
The New Zealand Dollar (NZD) trades firmly even as China’s Consumer Price Index (CPI) data for August has come in softer-than-projected. Inflationary pressures in China have declined at an annual pace of 0.4%. China’s annual inflation was expected to decline but at a slower pace of 0.2% after remaining flat in July. On a monthly basis, China’s CPI remained flat.
Technically, declining inflationary pressures in China act as headwind for the NZD, given that the New Zealand (NZ) economy relies heavily on its exports to Beijing.
Meanwhile, the US Dollar (USD) trades steadily ahead of the United States (US) Producer Price Index (PPI) data for August, which will be published at 12:30 GMT.
NZD/USD trades at a make-or-break level near the downward-sloping trendline around 0.5930, which is plotted from the July 1 high near 0.6120. The near-term trend of the pair is bullish as it trades above the 20-day Exponential Moving Average (EMA), which is around 0.5900.
The 14-day Relative Strength Index (RSI) approaches 60.00. A fresh bullish momentum would emerge if the RSI breaks above that level.
Going forward, the Kiwi pair would rise towards the June 19 high of 0.6040 and the September 11 low of 0.6100 if it manages to return above the psychological level of 0.6000.
In an alternate scenario, a downside move by the pair below the August 2 low of 0.5800 will expose it to the April 11 low of 0.5730, followed by the round-level support of 0.5700.
NZD/USD daily chart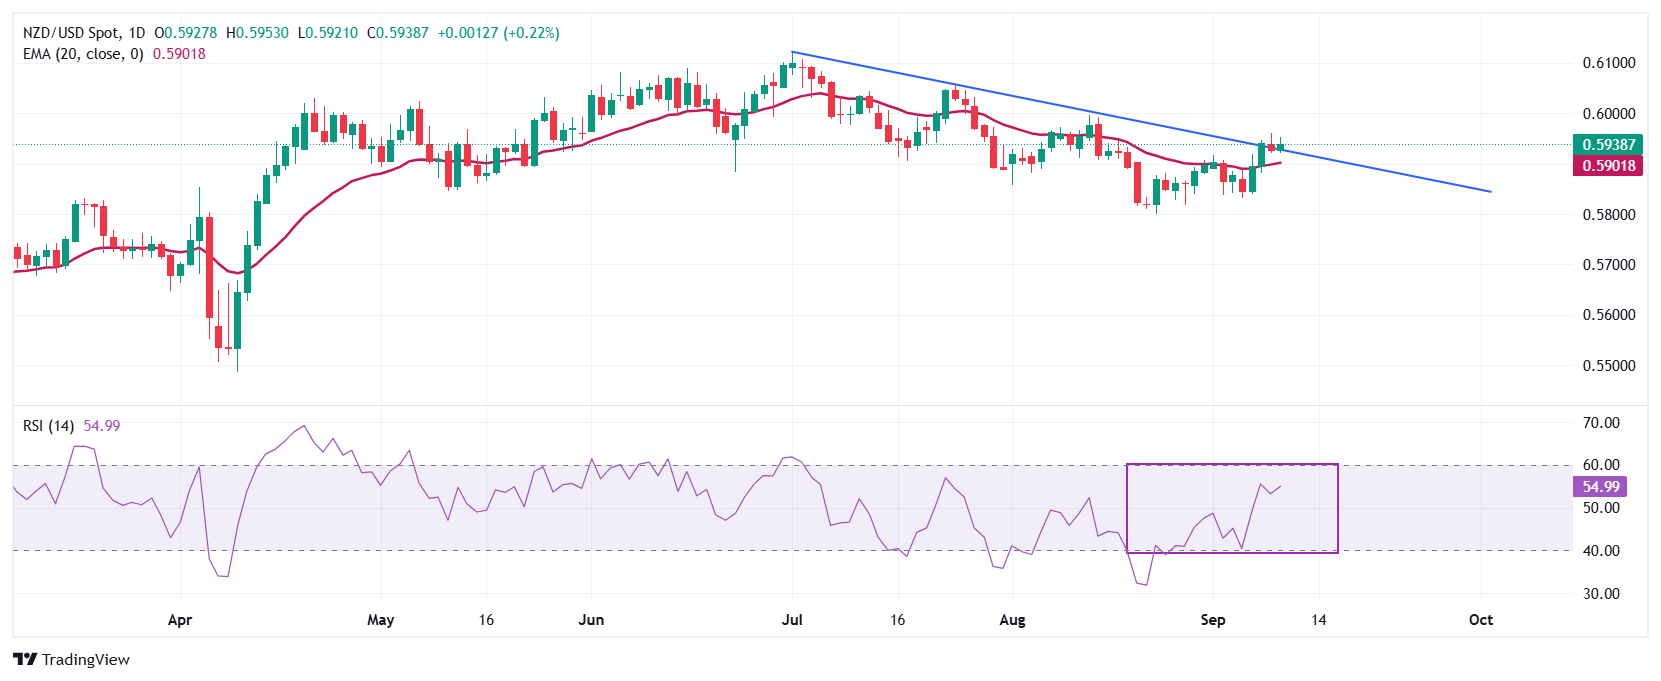
Publication date:
2025-09-10 12:35:52 (GMT)